Results Comparison IV: Mediocrity Personified
Previous Entries
Results Comparison: The Explanation
Results Comparison I: After 10 Games
Results Comparison II: State of Leafs Nation
Results Comparison III: Surprise!
As I get better at manipulating Blogger and my information I'll try to make these comparisons more reader friendly [regardless of how insane I might go trying]. I added a look at the last ten games, in this case # 31-40, from both comparisons and this year. As well, I have a look at how the Leafs fared in games # 41-50 last year and their schedule for the corresponding fixtures this year.
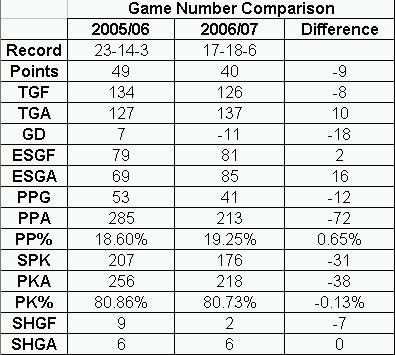
Game Number Comparison
Equivalent Fixtures Comparison
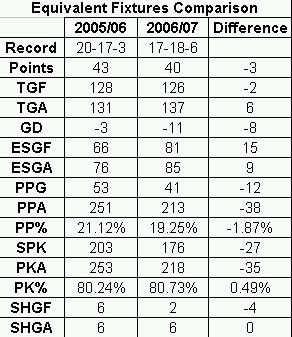
This comparison also shows that the Leafs have improved their offence at even-strength but have not, through 40 games, been any tougher to play against 5-on-5. Both comparisons show that the Leafs have improved their discipline but have also been given about one powerplay less per game. The Leafs have the fifth ranked powerplay which means that the decrease in man advantages has cost the Leafs about eight goals.
Games 31-40 Comparison
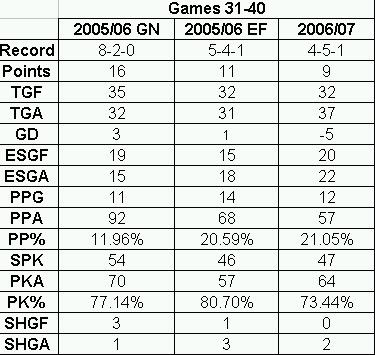
I would imagine that looking at this comparison might upset Paul Maurice. The Leafs have extremely similar numbers to games 31-40 from last year but picked up seven fewer points. This table shows how tight the difference between success and mediocrity is in the NHL post-lockout. A swing in goal differential of 8 goals in 10 games resulted in a swing of seven points over the previous season.
Next 10 Games
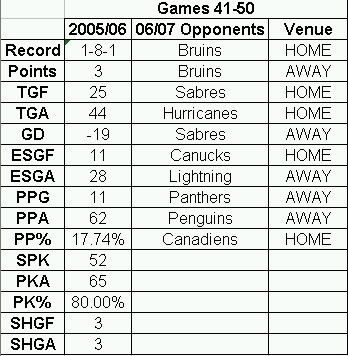
The Leafs have begun to play the games that correspond to the beginning of the horrific streak from January and February that cost the Leafs a shot at the playoffs. This freefall corresponded with a number of injuries including losing Bryan McCabe and Darcy Tucker for most of these games. This year the Leafs have even wider spread injury problems but they are 3-2 so far in this 10 game segment of the season which is already an improvement of three points with five games left to catch up to at LEAST last year's pace.
While this post is a bit of a downer there are a number of reasons for optimism. The first is that, in addition to how poorly the Leafs played during games 41-50 last year, during games 51-60 the Leafs went 3-6-1. That means that over the part of the schedule that corresponds to the next 20 games the Leafs went 4-14-2. Already the Leafs have gone 3-2. Perhaps most encouraging, even moreso than Steen and O'Neill's resurgence, has been Raycroft's play in the new calendar year.
Since the ball dropped in Times Square he has a .914Sv% and 2.40GAA. More importantly, he has been making big saves when the Leafs have needed them. The team has not always been able to capitalize on the chances that he has provided them but he is providing them in the way that he did before he hurt his groin in November and that bodes well for the Leafs.
Labels: Analysis, Andrew Raycroft, Toronto Maple Leafs
posted by PPP at 12:26 AM
![]()
![]()

0 Comments:
Post a Comment
<< Home